

AI Is an Amplifier. Unmetered Digital Growth Is the Problem.

The concern is real. The way through it is measurement and constraint.
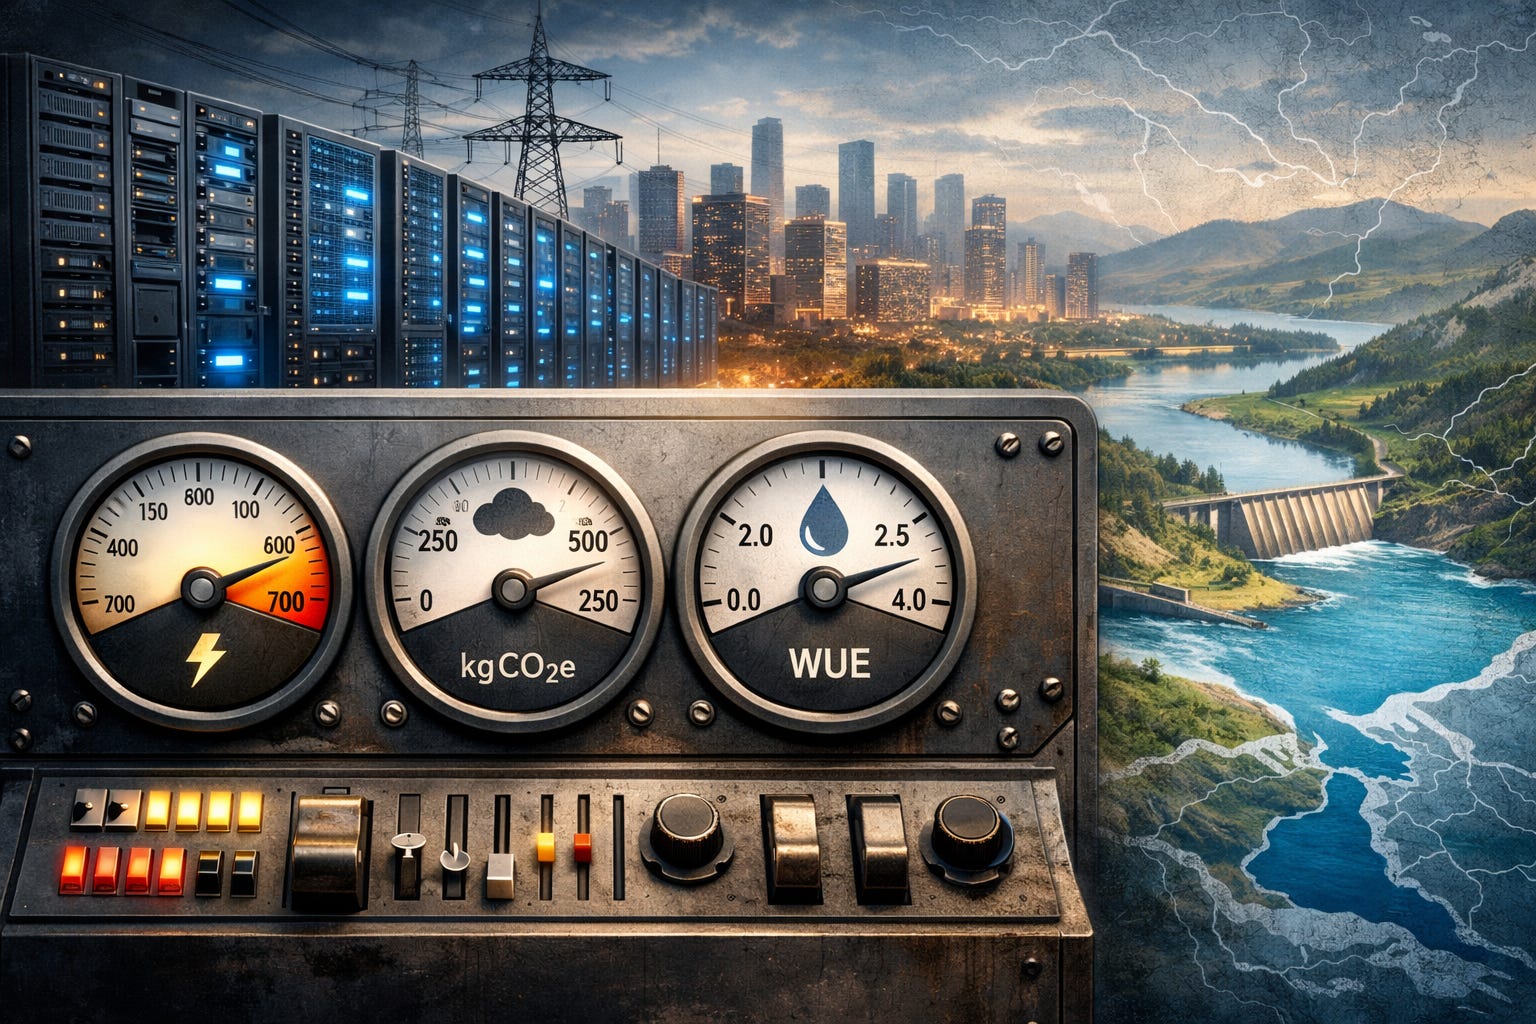
No units, no claims.
No baselines, no conclusions.
No budgets, no control.
AI is not uniquely evil among digital workloads. It is the newest high-leverage workload on top of an already-large baseline: streaming, screens, storage, always-on networks, and devices that never quite turn off. The system is the load. AI just makes it easier to add more load.
So the operational lever is boring on purpose:
Meter the stack.
Budget the stack.
Publish baselines.
Enforce caps where constraints demand them.
Nature does not accept vibes as a measurement method.
Jevons first, because it explains why efficiency is not the win
Efficiency lowers the cost per unit. Systems respond by doing more units. Total load can rise even as each unit gets cheaper. If you want savings, you need constraints that survive success. [13][14]
The threshold: from personal behavior to infrastructure
Two things can be true at the same time:
For a person, a handful of text prompts is usually small next to streaming, screens, and the rest of modern life.
For a grid, data center growth is big enough to matter for permitting, capacity, and peak planning.
If you want a planning anchor you can defend in public, use the LBNL (DOE-backed) numbers: [1][2]
US data center electricity use rose from 58 TWh (2014) to 176 TWh (2023). [2]
Scenarios project roughly 325 to 580 TWh by 2028. [2]
That is why the right framing is not "AI is a drop in the bucket."
It is "AI is one large load among several large loads on an already-stressed system."
Unit discipline before you compare anything
Energy: kWh (or Wh).
Emissions: kgCO2e. Do not convert emissions to kWh without stating the emissions factor, geography, and scope.
Water:
Withdrawal: water taken from a source. [5]
Consumptive use: water not returned to the immediate environment in usable form. [5]
If you cannot separate withdrawal from consumptive use, stop making water claims.
An illustrative comparison, with assumptions stated
Per-action numbers are not policy units. They are intuition pumps. Treat them as illustrative, not universal.
One good pair of illustrative anchors:
Streaming: IEA analysis suggests Netflix streaming in 2019 typically consumed about 0.077 kWh per hour (device, network, and resolution sensitive). [3]
Typical LLM text interaction: Epoch AI estimates a typical GPT-4o ChatGPT query at roughly 0.3 Wh (0.0003 kWh), with wide variance by tokens and behavior. [4]
Order-of-magnitude math only:
0.077 kWh per hour is 77 Wh.
77 Wh / 0.3 Wh is about 250 typical text queries.
Do not worship the ratio. Use it to remember what your household already spends energy on: sustained video plus screens, not occasional text prompts.
If someone wants to litigate one number, they are choosing the wrong battlefield. The lever is still governance: baselines, budgets, caps, enforcement.
Water: same story, sharper consequences
Energy debates get abstract. Water does not. Water is local, seasonal, and political the moment it touches a stressed basin.
A useful starting definition for basin stress is withdrawals relative to available renewable supply. It is a screening indicator, not the last word, so you still validate locally. [6]
A concrete example of why local is the only adult unit:
AP reported that in July 2022, Microsoft data centers in West Des Moines used about 11.5 million gallons of water for cooling, and local officials pushed for peak reductions going forward. [11]
This is the point:
"Uses water" is not a meaningful claim unless you can explain where, when, and what happens at peak week.
Peak week is when spreadsheets turn into policy.
WUE (Water Usage Effectiveness) helps keep the conversation concrete: liters per kWh, standardized and comparable when reporting is honest. [8][10]
A Water Receipt Card you can actually demand
Basin
Named basin
Current stress indicator you are using
Local validation source (not just a dashboard)
Facility water
Withdrawal (monthly, peak week)
Consumptive fraction (how much is not returned in usable form)
Any return flow quality impacts (if applicable)
Operations reality
Peak-week trend line (hot month behavior, not annual averages)
Cooling approach and what triggers water use
Decision rule
If leadership cannot produce this card quickly, you do not have governance, you have a story.
AI can be part of the solution, but only inside metered loops with bounded authority
AI does not fix externalities by existing. It helps when it reduces waste inside a governed system.
Example: data center cooling optimization
DeepMind reported ML control for Google data center cooling, with headline results up to about a 40% reduction in energy used for cooling, tied to operational measurement and constrained control. [7]
Example: grid operations and forecasting
NREL notes that better wind and solar forecasting improves grid operations and can reduce integration costs by reducing uncertainty that drives reserves and curtailment. [12]
That pattern generalizes:
Inside measurement loops, AI can reduce waste.
Outside measurement loops, AI mostly increases throughput, and Jevons does the rest.
Who has to act
This is not a personal virtue contest. It is coordination.
Enterprises: require metering and publishable baselines in procurement, put budgets and caps in contracts.
Operators: publish site-level baselines and peak-week trends where communities face the constraint (and use standardized metrics like WUE). [8][10]
Utilities and regulators: treat large loads like infrastructure, require impact statements, make caps real where grids and basins are tight.
Communities: ask for the Water Receipt Card before the next permit gets approved.
Close
AI is not the devil. It is the newest high-leverage workload riding on top of a digital lifestyle that already runs hot.
Unmetered digital growth is the ratchet. AI just turns the handle faster.
Meter the stack. Budget the stack. Publish baselines. Enforce caps.
Per ignem, veritas.
AI is not Fenrir. It is another wolf. Govern the wild hunt.
Sources
[1] Shehabi, Arman; Masanet, Eric; Horner, Noah; Smith, S.J.; Sartor, Dale. 2024. 2024 United States Data Center Energy Usage Report. Lawrence Berkeley National Laboratory (LBNL-2001637). https://eta.lbl.gov/publications/2024-lbnl-data-center-energy-usage-report
[2] U.S. Department of Energy. December 20, 2024. DOE Releases New Report Evaluating Increase in Electricity Demand from Data Centers. https://www.energy.gov/articles/doe-releases-new-report-evaluating-increase-electricity-demand-data-centers
[3] International Energy Agency (IEA). The carbon footprint of streaming video: fact-checking the headlines. https://www.iea.org/commentaries/the-carbon-footprint-of-streaming-video-fact-checking-the-headlines
[4] Epoch AI. Feb 7, 2025. How much energy does ChatGPT use? https://epoch.ai/gradient-updates/how-much-energy-does-chatgpt-use
[5] U.S. Geological Survey (USGS), Water Science School. Water use: withdrawals and consumptive use (terminology and concepts). https://www.usgs.gov/special-topics/water-science-school/science/water-use-how-water-used
[6] World Resources Institute (WRI) Aqueduct. Baseline water stress definition (withdrawals relative to available renewable supply). https://www.wri.org/aqueduct
[7] DeepMind. 2016 (updated reporting in later years). DeepMind AI reduces Google data centre cooling energy. https://deepmind.google/discover/blog/deepmind-ai-reduces-google-data-centre-cooling-bill-by-40/
[8] Microsoft. Data center sustainability and efficiency metrics (includes WUE expressed as L/kWh). https://datacenters.microsoft.com/sustainability/efficiency/
[9] Microsoft Azure Blog. WUE calculation approach for data centers (context and reporting). https://azure.microsoft.com/blog/wue-water-usage-effectiveness/
[10] ISO/IEC 30134-9:2021. Information technology - Data centres - Key performance indicators - Part 9: Water usage effectiveness (WUE). https://www.iso.org/standard/63430.html
[11] Associated Press. AI technology behind ChatGPT was built in Iowa with a lot of water (West Des Moines, July 2022 water use). https://apnews.com/article/artificial-intelligence-chatgpt-water-use-iowa-288e0f3e4d4959b7ea8f4b3e2a7fdc2e
[12] National Renewable Energy Laboratory (NREL). Solar and wind forecasting improves grid operations and integration. https://www.nrel.gov/grid/forecasting.html
[13] Sorrell, Steve. 2009. Jevons' Paradox revisited: The evidence for backfire from improved energy efficiency. Energy Policy 37(4). https://www.sciencedirect.com/science/article/pii/S0301421508004789
[14] Gillingham, Kenneth; Rapson, David; Wagner, Gernot. 2016. The Rebound Effect and Energy Efficiency Policy. Review of Environmental Economics and Policy. https://environment.yale.edu/sites/default/files/files/Gillingham_etal2016_REEP_rebound_effect.pdf